Dashlight Studio


Dashlight Studio is the portfolio equivalent of a concept album.It might seem like a mix of unrelated work — dashboards, data strategy, change management, and fiction writing — but it’s all connected.

This is the body of work I’ve built across a career shaped by curiosity, systems thinking, and a drive to make things make sense. All of it has meaning to me.
If you’re here to explore, hire, or just get a better sense of what I do — I’m glad you found your way here.


Selected Sample Dashboards


These dashboard projects are built on fictional data, designed to reflect the kinds of reporting problems I’ve solved over the past decade. To protect my former employers and clients, no data shared here is real — but each sample is based on real organizational needs, data structures, and bottlenecks.


Problem: A distributed team of data annotators lacked clarity on productivity, workload balance, and output trends across time and geography.
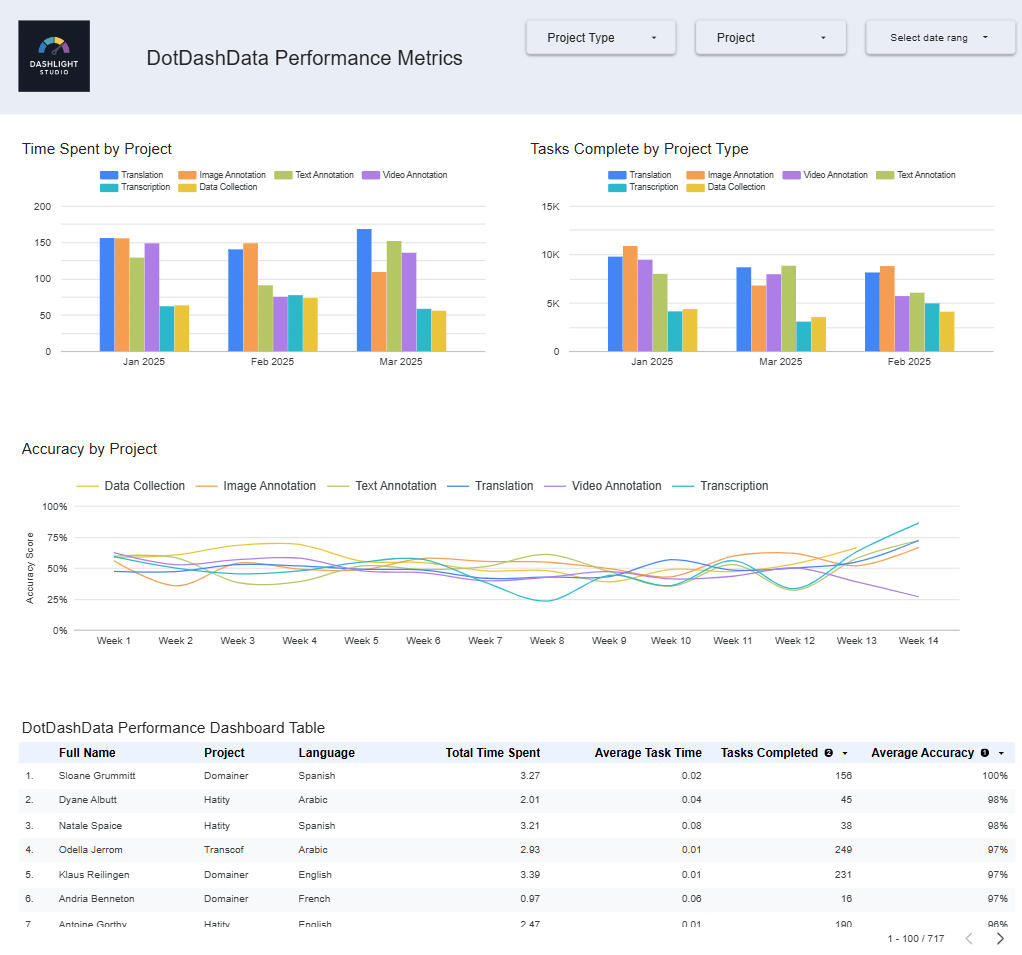


Solution: Designed a dashboard for operations and team leads to track daily task completion, average task duration, and workflow split by user — allowing management to quickly spot outliers and adjust staffing.


Vertex Industrial Supplies


Problem: Regional sales managers couldn’t reconcile sales outcomes with fulfillment delays, and leadership had no consolidated view of representative performance.
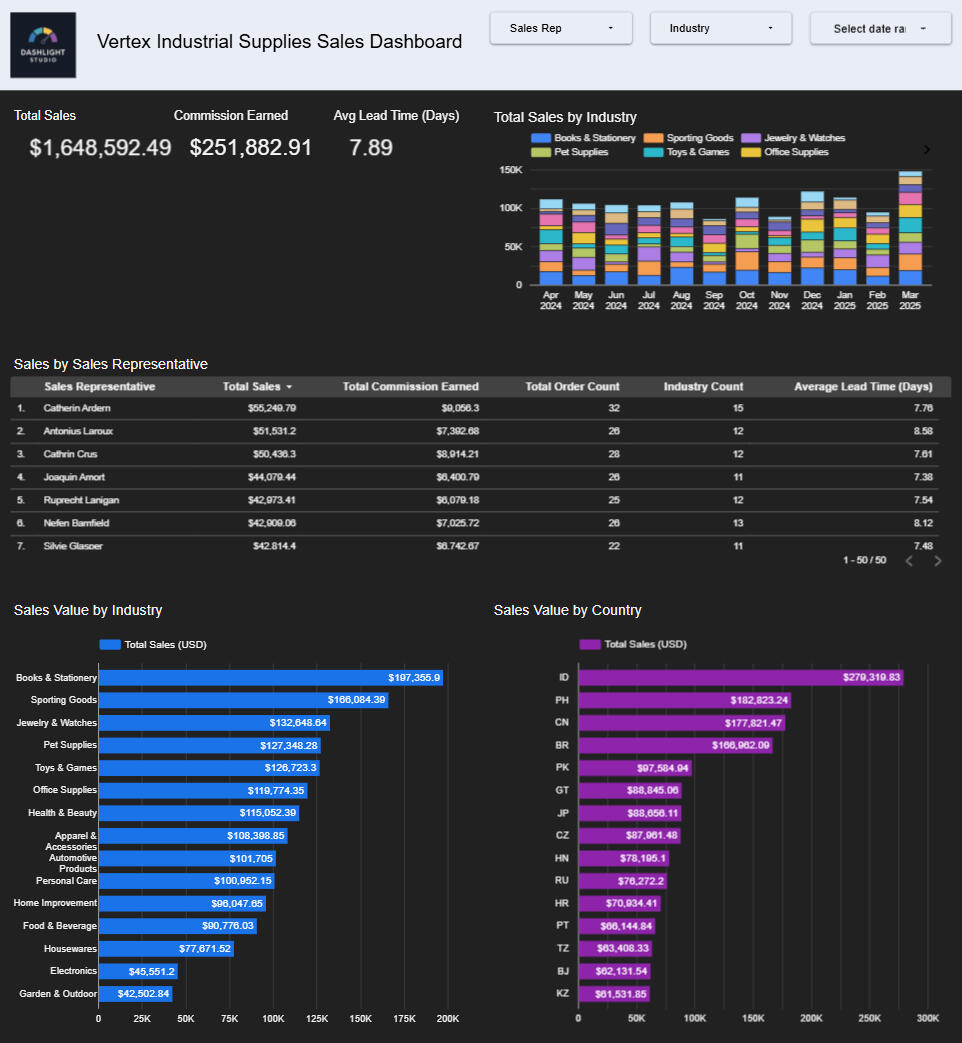


Solution: Built an integrated dashboard showing sales volume by product line and region, rep-level performance over time, and fulfillment gaps — enabling targeted inventory adjustments and rep coaching.


Problem: The support team was experiencing burnout and inconsistent resolution times, but leadership had no clear view of agent workload or spikes in volume.
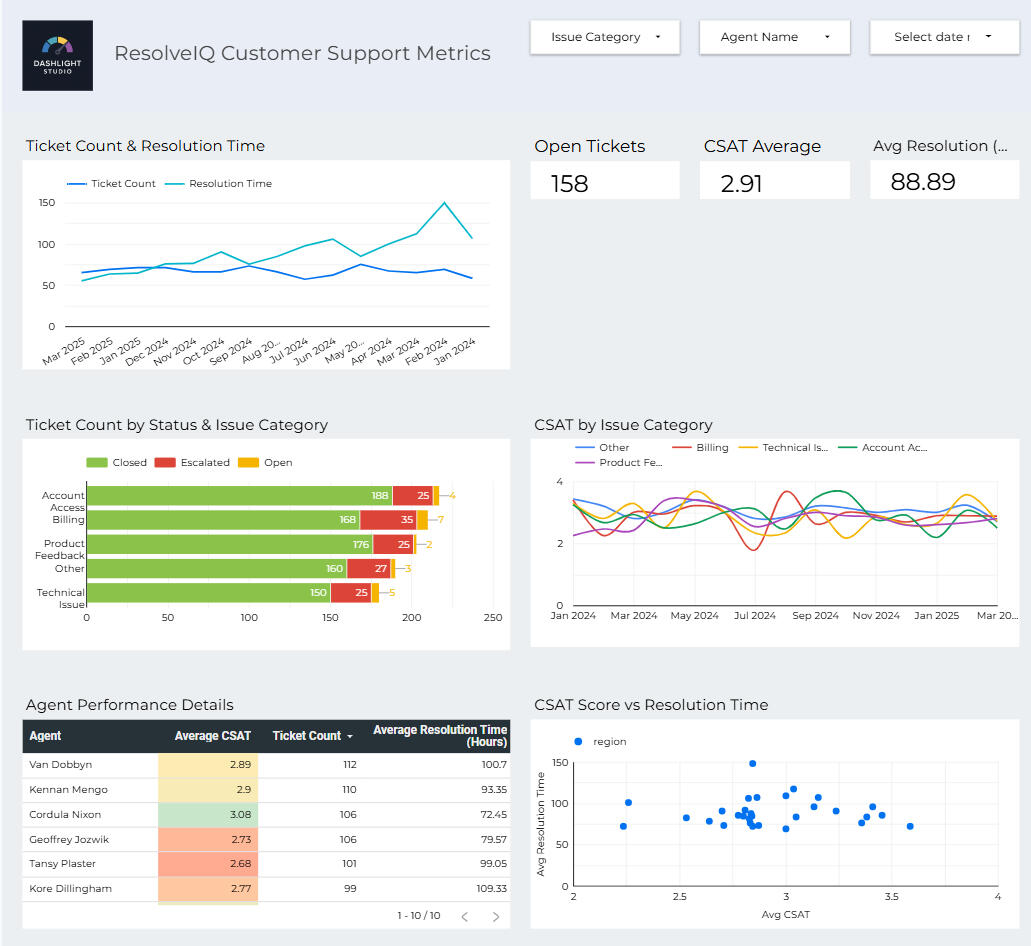


Solution: Created a dashboard tracking resolution times, agent-level ticket volume, and spike alerts. Included filters for category and escalation level to support daily standups and staffing decisions.


Hello, new friend — I'm Cara! I built my career at the intersection of project management, data, and reporting.For over a decade, I’ve supported teams in making performance data answer business questions. My focus is on building dashboards that reduce reporting overhead, surface relevant metrics, and help people make faster, more confident decisions.

When I'm not building dashboards, I'm managing projects and change initiatives.

Also sometimes I write books.


I work primarily in Looker Studio and specialize in designing dashboards that are:

  • Clear enough for non-technical stakeholders

  • Flexible enough for different audiences

  • Rooted in real-world reporting problems


Project & Change Management

Case Studies & Blogs


BLOG: “People Don’t Want to Change” Is a Lazy Lie


You’ve heard it before — maybe even said it yourself:“People just don’t want to change.”It’s the rallying cry of a thousand top-down initiatives, usually spoken with a sigh after a failed rollout, a tanked adoption metric, or a particularly testy Q&A with the folks who are actually doing the work.But here’s the thing: that sentence almost always tells me more about the speaker than the team.Because in my experience, people don’t resist change for fun. They resist it because what you’re asking them to do sounds harder, riskier, or less sensible than what they’re already doing. And sometimes? They’re right.If your change initiative is landing like a lead balloon, it’s worth asking — are you giving people more problems, not solutions?Maybe you’ve introduced a new system that adds six clicks to their workflow. Or a new KPI that doesn’t map cleanly to the way their job is structured. Or a “streamlined” process that now requires three different approvals from departments that never talk to each other.In the meeting room, it all made sense. On the floor, it breaks down.That’s where real change management starts — not with a training deck or a comms calendar, but with actual business understanding. The kind you don’t get from a dashboard alone.Get out of your seat. Go see the work. Go gemba, if that language resonates with you. Ask questions. Watch. Listen. Build your change plan from the ground up, not just the org chart down.The truth is, most people don’t mind change. They mind chaos. They mind fragility. They mind someone messing with their workflow without respecting their expertise. If you want buy-in, earn it. Not with cheerleading, but with clarity.When people see that the new way actually works better — that it solves problems they care about — they don’t resist. They often become your biggest allies.But you don’t get there by assuming resistance is just “human nature.” You get there by treating resistance like what it usually is: information.


Case Study: Building a Dashboard from Scratch for a Human-Centered Annotation Team


When I joined [Company Redacted] as a Product Operations Manager, our in-house data annotation team — a tight-knit, salaried group — had no formal time tracking system. They were managing annotation projects through Google Sheets and submitting no timecards. We had no reliable way to track throughput, capacity, or individual performance.


🧠 Challenge

We needed to:

  • Track hours and annotation volume daily per annotator

  • Create manager- and project-level rollups

  • Define success metrics (which didn’t yet exist)

  • Validate self-reported data against source-of-truth logs once available

  • Do it all without existing infrastructure or historical benchmarks


Solution Overview

🗂️ Phase 1: Implementing the Tracking System

  • Rolled out Monday.com to the entire annotator team for daily tracking of hours worked and jobs completed.

  • Built an intuitive weekly board structure to match the team’s working cadence.

  • Led a change management campaign: documentation, 1:1 coaching, weekly reminders, and regular feedback loops to increase adoption.


📊 Phase 2: Dashboard Development in LookerStudio

  • Extracted daily entries and piped them into a Google Sheet that powered a LookerStudio dashboard.

  • Created custom VLOOKUP spiderwebs to:

  • Map annotators to their managers

  • Enrich entries with project metadata

  • Developed summary views by annotator, project, and manager — no backend database, just clever sheet logic.

🔁 Phase 3: Adding Performance Targets and Validating with System Logs

  • Worked with the Director to define weekly targets (hours + job counts) for the first time and create process for ongoing target setting and reflection.

  • Aggregated daily entries to measure performance against these targets.

  • Once platform data became available, integrated backend exports to:

  • Compare self-reported hours vs. platform-captured hours

  • Visualize discrepancies for quality assurance

🌍 Phase 4: Scaling for Offshore Teams

As we expanded to offshore annotators (no access to Monday.com), I:

  • Filtered dashboard logic to display system data only

  • Preserved a consistent view across both populations

📈 Impact

  • Created the first standardized performance reporting system for the team, where none existed before

  • Increased operational visibility for leadership across locations, projects, and individuals

  • Gave managers tools to identify support needs, recognize high performers, and assess workload balance

  • Enabled data integrity checks between human-reported and machine-captured time

🎯 What Made This Hard (And Worth Doing)

  • The data didn’t exist — I built the system that generated it

  • No shared keys; VLOOKUP glue held the system together

  • The platform evolved, and so did the dashboard — I iterated live

  • The team was hesitant at first — I earned adoption through empathy and consistency

  • Nothing off-the-shelf — this was crafted by hand to meet real operational needs


Draw One in the Dark


Draw One in the Dark - on Amazon

Some towns fall off the map. Others disappear on purpose.In the shadows of a fractured America, the town of Adelaide has kept its distance. No phones, no internet, no interference. For nearly a decade, it’s worked. People grow their food, mind their neighbors, and don’t ask too many questions until Samuel Wolfe arrives.What unfolds next is a quiet reckoning. Secrets surface. Loyalties shift. And the fire that nearly destroyed Adelaide once may be the only thing that can save it again.Draw One in the Dark is a slow-burning dystopian novel about memory, resistance, and the power of a town that refuses to vanish.


Get the Money You Deserve


Get the Money You Deserve - on Amazon

Have you been injured on the job? Struck by a vehicle? Screamed at by a woman named Veda while sorting medical records at 10PM on a Wednesday?You may be entitled to Get The Money You Deserve.Bea Lloyd wanted to help people. Instead, she landed at a personal injury firm where suffering is monetized, paralegals are disposable, and the phrase "client care" means keeping the screaming to a dull roar.Equal parts hilarious, infuriating, and too true to be entirely fiction, The Money You Deserve is for anyone who's ever wanted to walk out of their office and never, ever go back.